Vanguard Digital Advisor
A semester-long redesign of Vanguard's robo-advisor for people who are new to investing, from a six-person usability study to a tested high-fidelity prototype.
Built in MEJO 581: User Experience Design and Usability at UNC Chapel Hill (Laura Ruel, Spring 2024), with feedback from Steve Shang, senior lead UX designer at Vanguard.
New investors found Vanguard's Digital Advisor hard to reach and hard to understand. 67% of our testers struggled to find it.
Ran a 6-person usability study with my group, built personas, card-sorted the content, then designed and tested wireframes and a hi-fi prototype.
Three new features aimed at jargon and navigation: more data visualization, a tooltip toggle, and a glossary.
- 0participants in our usability study
- 0personas built from that research
- 0rounds of usability testing
- 0new features in the final design
The problem
Digital Advisor is Vanguard's robo-advisor platform. For the college students and new graduates most likely to be opening a first investment account, it was hard to find and written in terms they didn't know: in our usability study, 67% of participants struggled to reach it from Vanguard's homepage. I set out to redesign it for people who are new to investing, with three goals.
-
Goal 01
Build financial literacy
Teach the basics of investing and take the mystery out of the jargon, so new investors feel informed and confident.
-
Goal 02
Break up onboarding
Split onboarding into manageable steps, guiding people through risk assessment, goal setting, and portfolio creation from their dashboard.
-
Goal 03
Give people a reason to come back
Make the platform worth exploring regularly, with more data visualization and chat support.
Success would show up in two places: how many people finish onboarding and return to the platform, and what they say in surveys and usability tests of the redesigned interface.
What six new investors told us
This section was done as a group project.
We tested the existing Digital Advisor pages with six undergraduates who had no prior knowledge of Vanguard, asking each to take on the role of a new investor. They found the site visually appealing and straightforward, but three problems kept coming up:
- Navigation: people struggled to find the Digital Advisor page at all.
- Terminology: investment terms went unexplained and got in the way of understanding.
- Layout: the overall layout and navigation confused participants.
Methodology
We ran every session in person between February 6 and February 22 and recorded it on Zoom. Each lasted 30–45 minutes and had five parts: introduction, warm-up, an evaluation of the Robo-Advisor page, follow-up, and wrap-up. Each part of the script had three tasks that mimic what someone would actually do on the site, paired with questions about what they were thinking as they went.
Participants
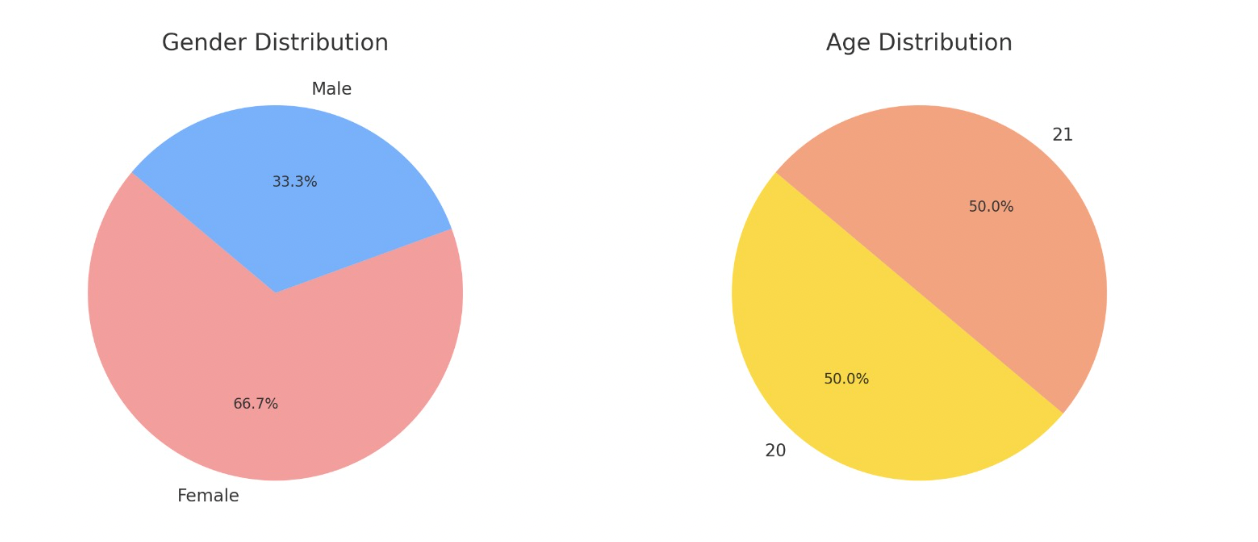
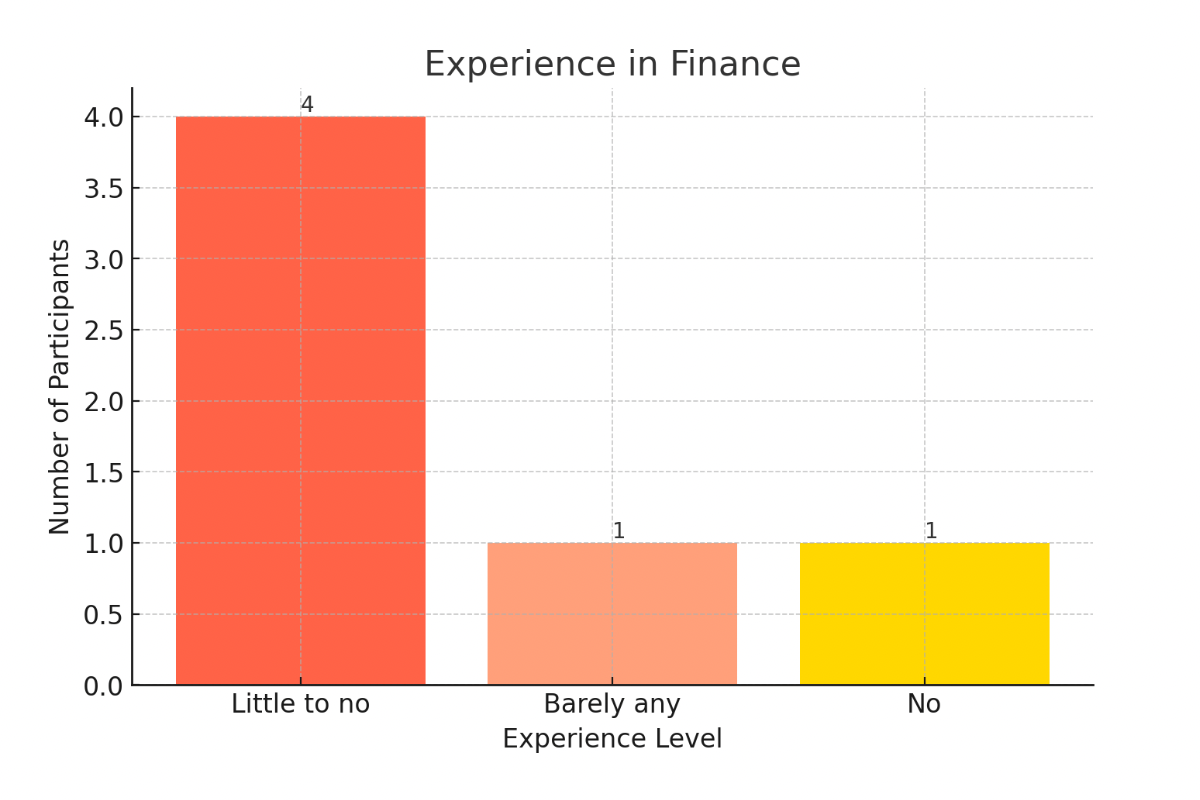
Study limitations
-
01
Sample bias
Six college students, mainly white women aged 20–21. Too small and too narrow a group to judge the site's usability fairly.
-
02
Little finance experience
Most participants knew little about investing, which skews their read of the site compared with a typical person looking to invest.
-
03
Not personalized
Participants couldn't enter their own information or create an account, so it was hard for them to picture the money on screen as their own.
What worked
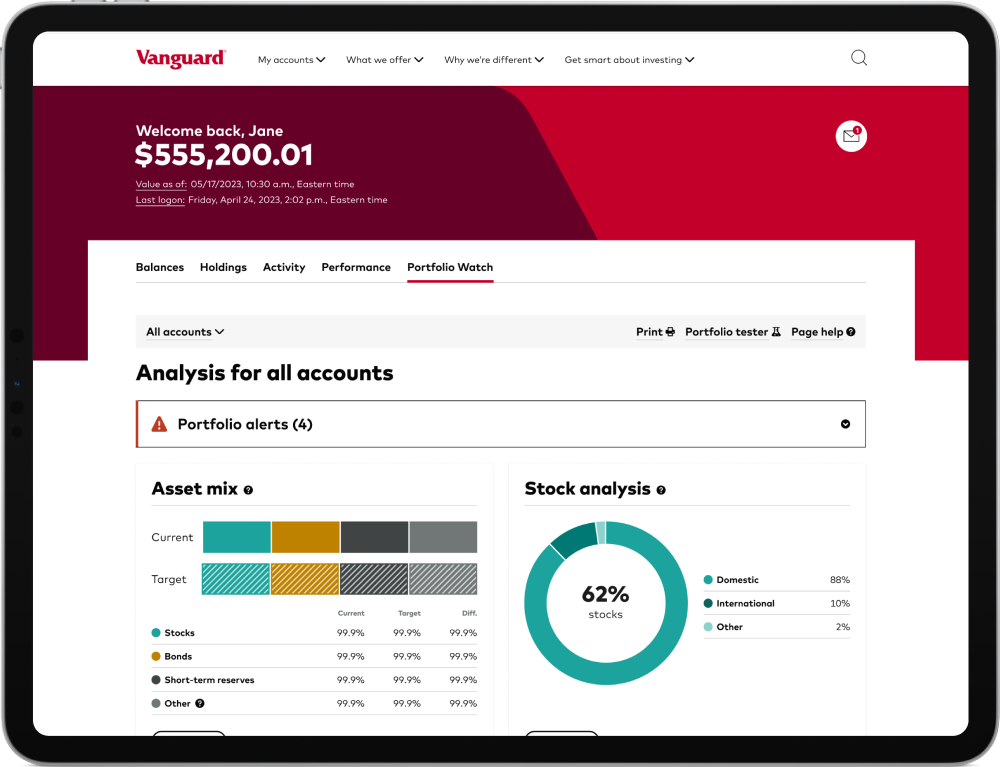
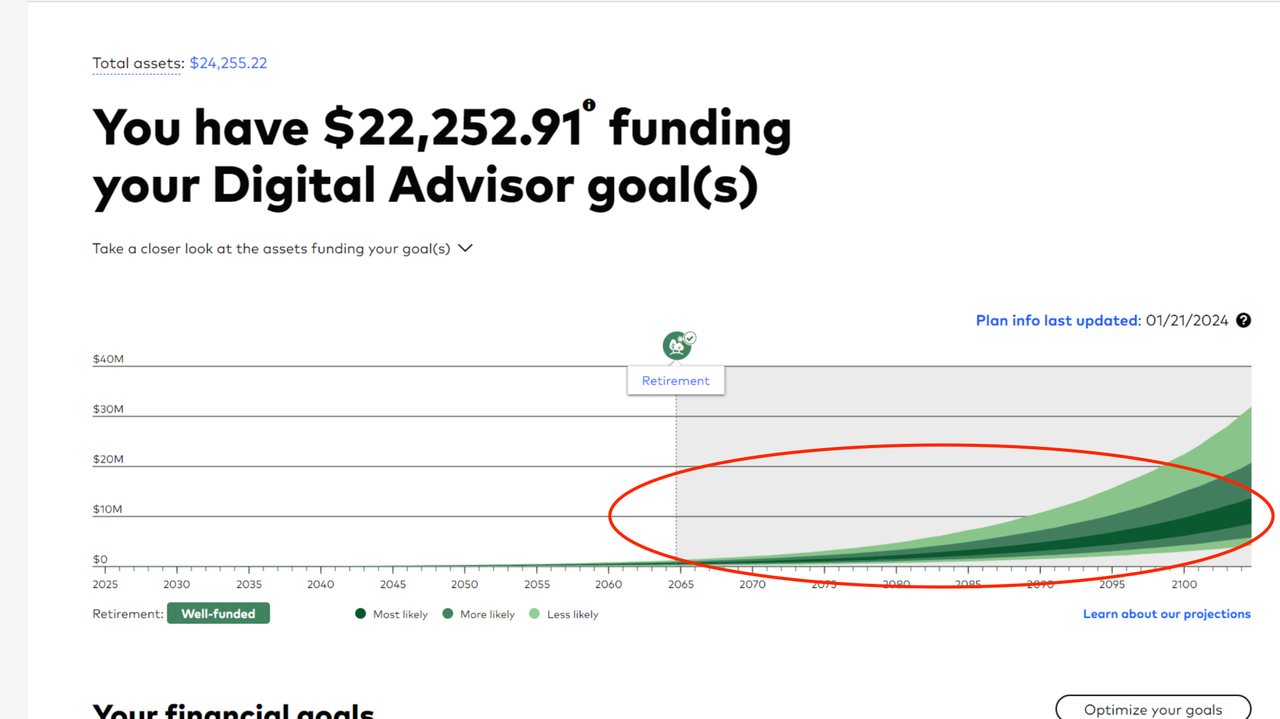
Data visualization
Many participants said the charts across the Digital Advisor pages and dashboard made the data easier to understand.
"I always like the summary slides.. Even in the Activity feed, especially with the Risk attitude, where you can visually see how you're investing. I think that makes a lot more sense than just being given statistical data."
Interactivity
Some participants pointed to the page's interactive elements as a highlight of exploring it. Participants also liked the overall design and layout.
What didn't
Unclear terminology
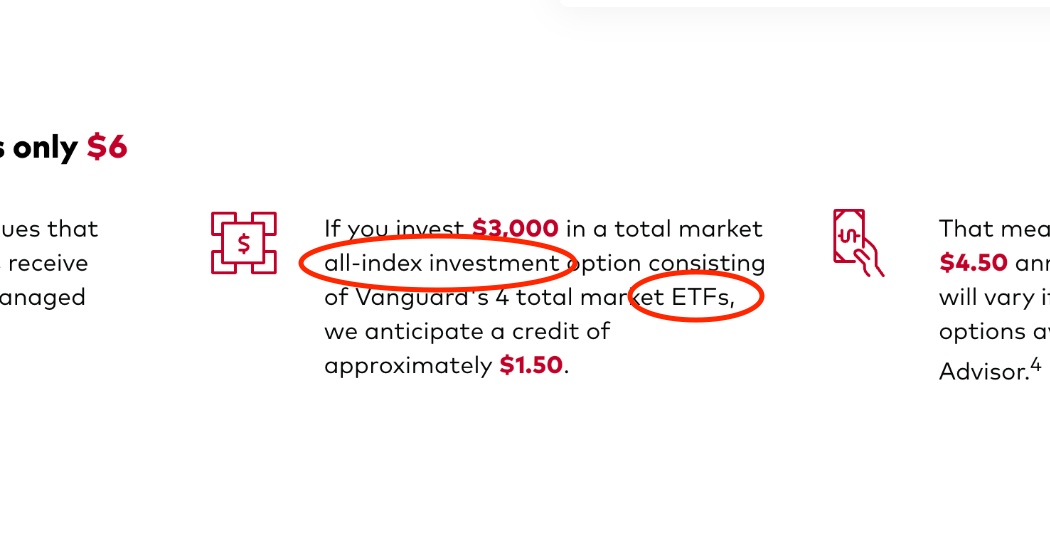
"There's definitely some lingo that - like ETFs; they give the exchange-traded funds, but what does that mean?"
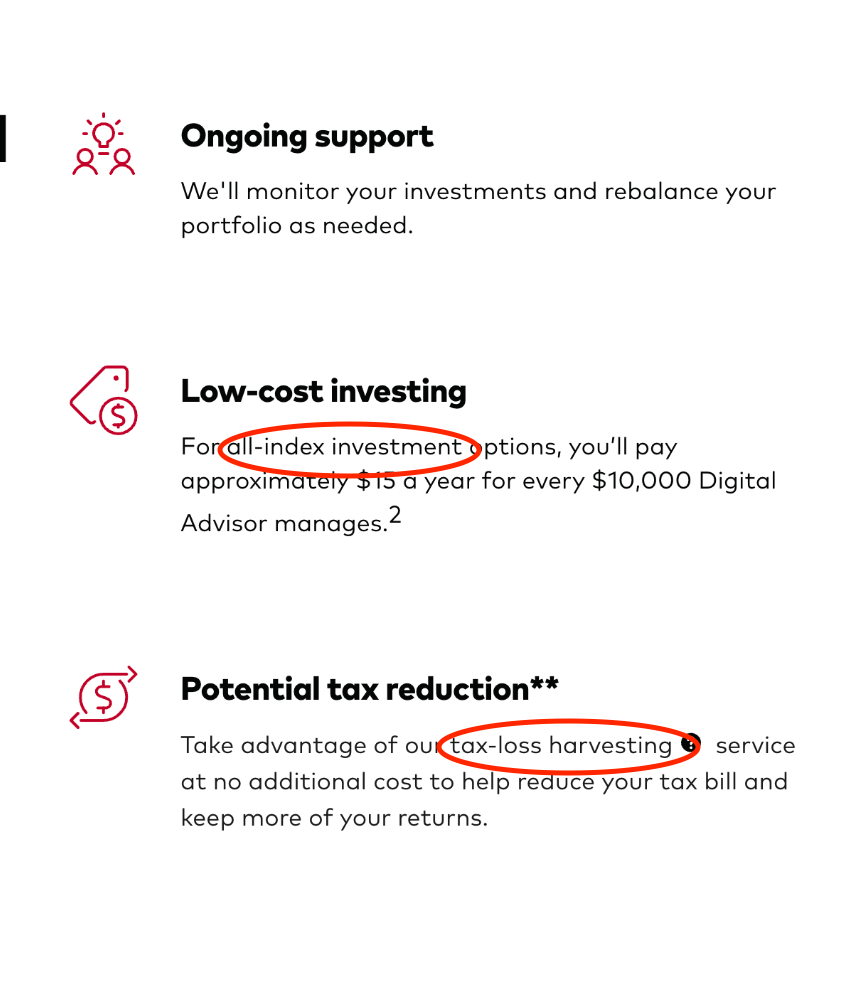
"I have no clue what TLH is… Yeah, I just have no idea what that means."
Repetition
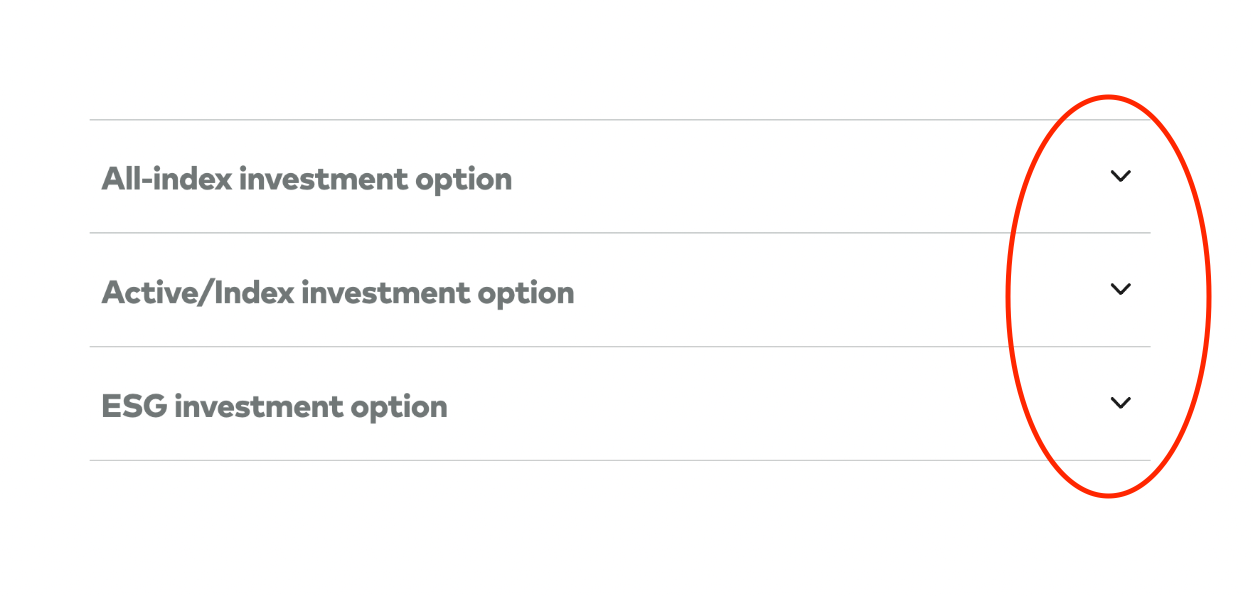
"It can be a little repetitive at times, like there are three "Get started" buttons."
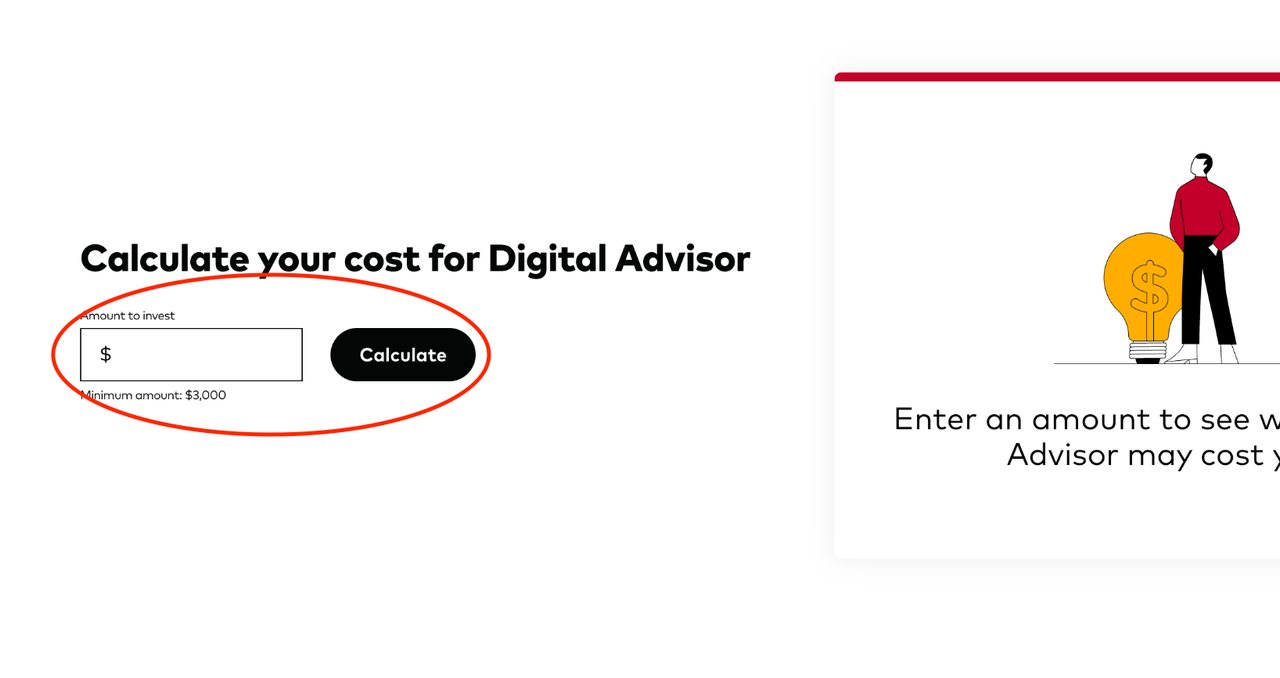
Finding the Digital Advisor
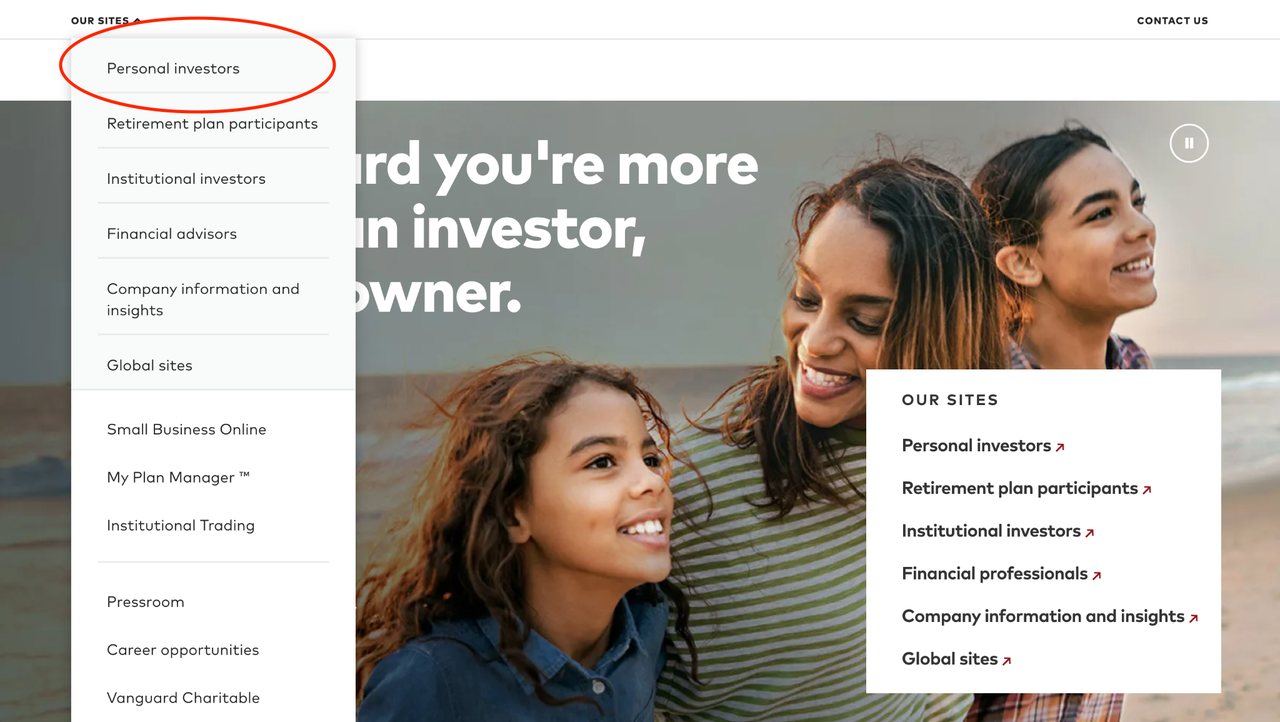
67% of participants had difficulty getting from the Vanguard homepage to the Robo Advisor page.
"It's not very easy to access the Robo Advisor"
Who we were designing for
This section was done as a group project.
My group and I turned our interviews into five personas, ranging from scared of investing to sure they don't need the help. Audience analysis chart (PDF) →
-
01
Finance Bro-Wannabe Ben
A business major who believes he should manage his money smartly. He owns a couple of stocks and sold sneakers in high school, but has never invested with a digital advisor.
-
02
Lost Lily
About to graduate, with no investing experience. Her parents taught her to save rather than risk it; she's heard investing is important but is scared and unsure where to begin.
-
03
Ambivalent Annie
Late 20s, with a stable job and a comfortable life. No preconceived notions about AI or investing, and open to starting an account, but she doesn't know much about it.
-
04
Hesitant Hank
Experienced with his own finances, less so with tech. Interested in a Vanguard account, but wants to learn how the Digital Advisor works before he trusts it with his money.
-
05
Business Bro Brad
Late 20s, and thinks he knows more about investing than anyone else. He'd consider an account if it were easier, but feels educated enough to do it himself.
Ben, in detail
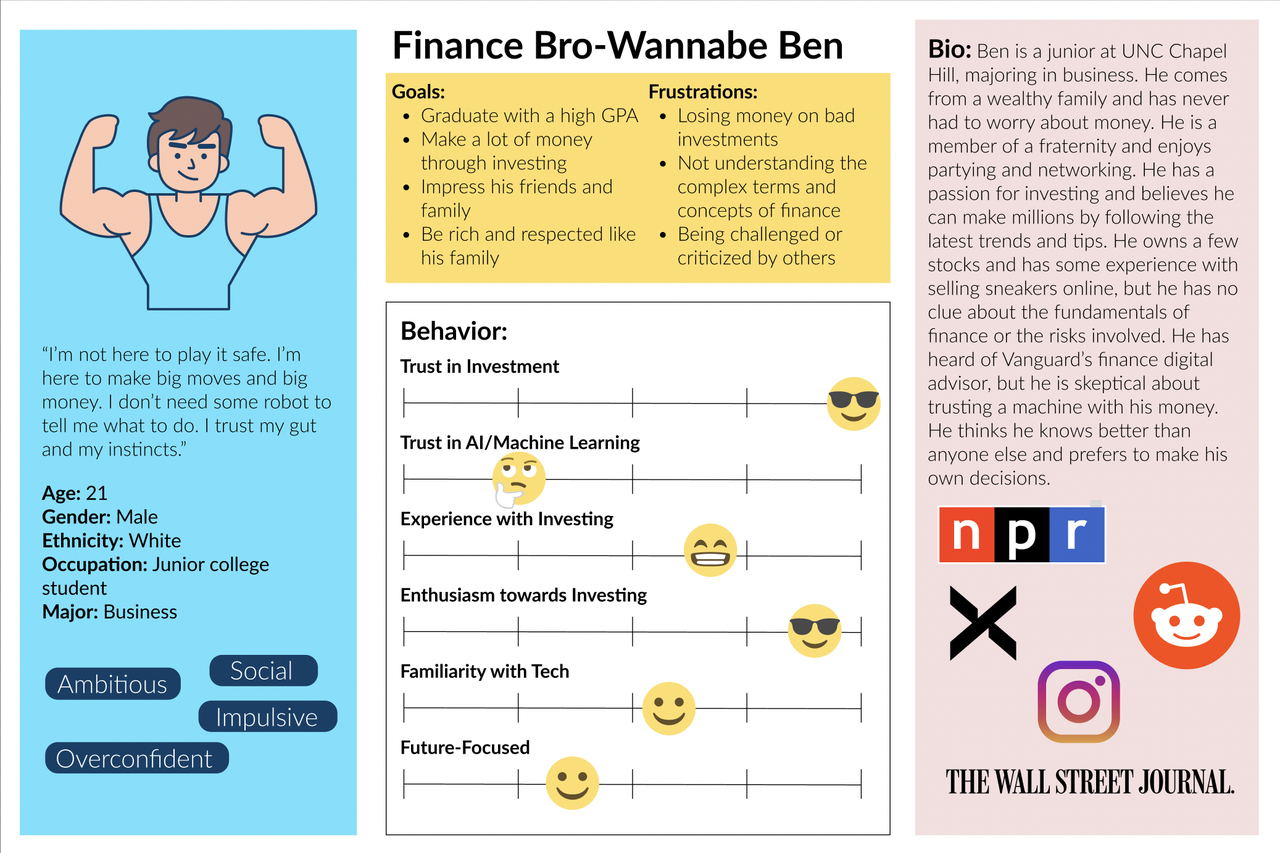
The interview questions behind the personas:
- What are your current financial goals and challenges?
- How do you approach investing and managing your money?
- What sources or tools do you use to learn about or make financial decisions?
- How familiar or comfortable are you with using technology or AI to assist you with your finances?
- What are some of the features or functions you would like to see in a digital advisor?
Empathy map
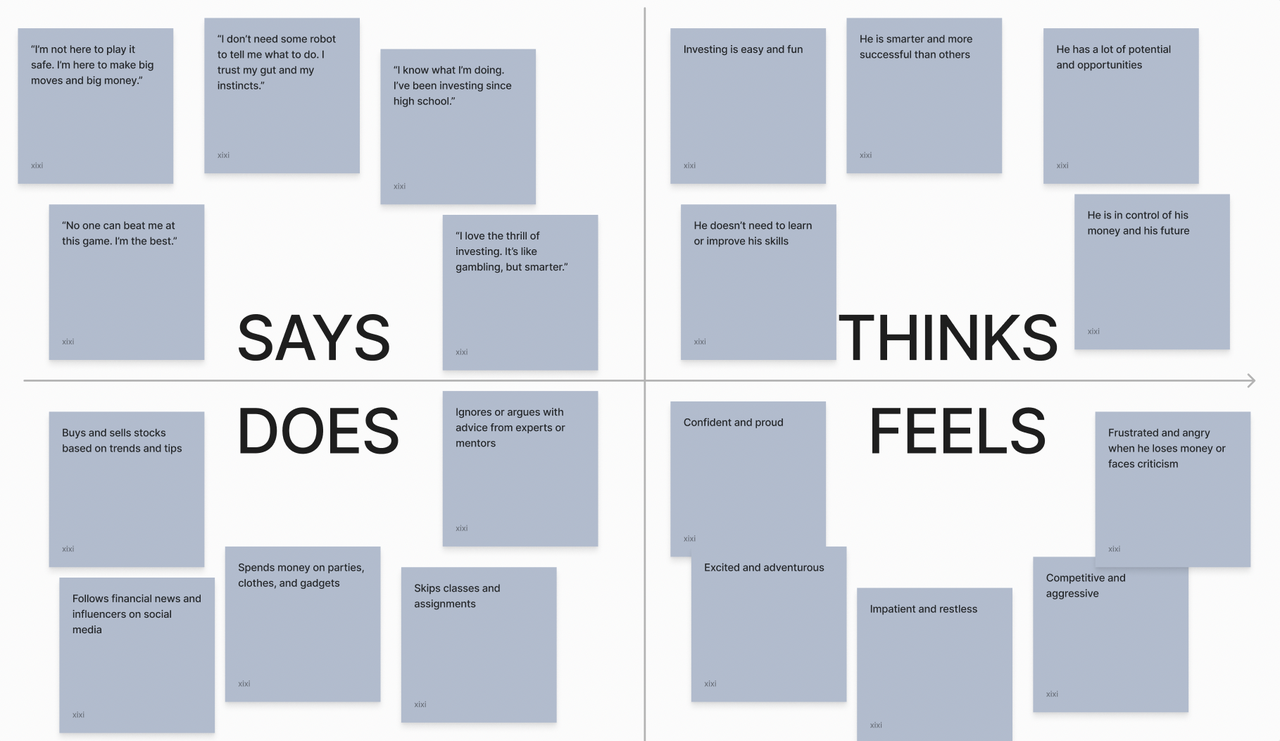
We used empathy maps and persona templates to synthesize the interviews, keeping what set each persona apart (personality traits, quotes, goals, frustrations, and how likely they were to use a digital advisor) and cutting what didn't, like hobbies, education, and family background.
Sorting the content, mapping the flows
I started from an AI-generated list of assets (Microsoft Edge's Bing Chat), then ran card sorts with users to narrow it down and organize it into four categories.
1. Informational content
- Portfolio performance
- User feedback and ratings
- Analyst recommendations
- User account data
- Market data feeds
- Investment glossary
2. Interactive elements
- FAQ
- Retirement planning calculator
- Asset comparison tools
- Investment coaching services
- Chat windows
3. Visuals
- Portfolio analysis report
- Data visualization
- Diversification score
4. Accessibility
- Accessibility options
- User onboarding tutorials
- Language and regional settings
Content hierarchy
Mapping the hierarchy showed that the Digital Advisor pages fall into two groups: informational and interactive. Reports and data (market data feeds, user account data) sit under informational content; financial planning tools (the retirement planning calculator, goal setting) sit under interaction.
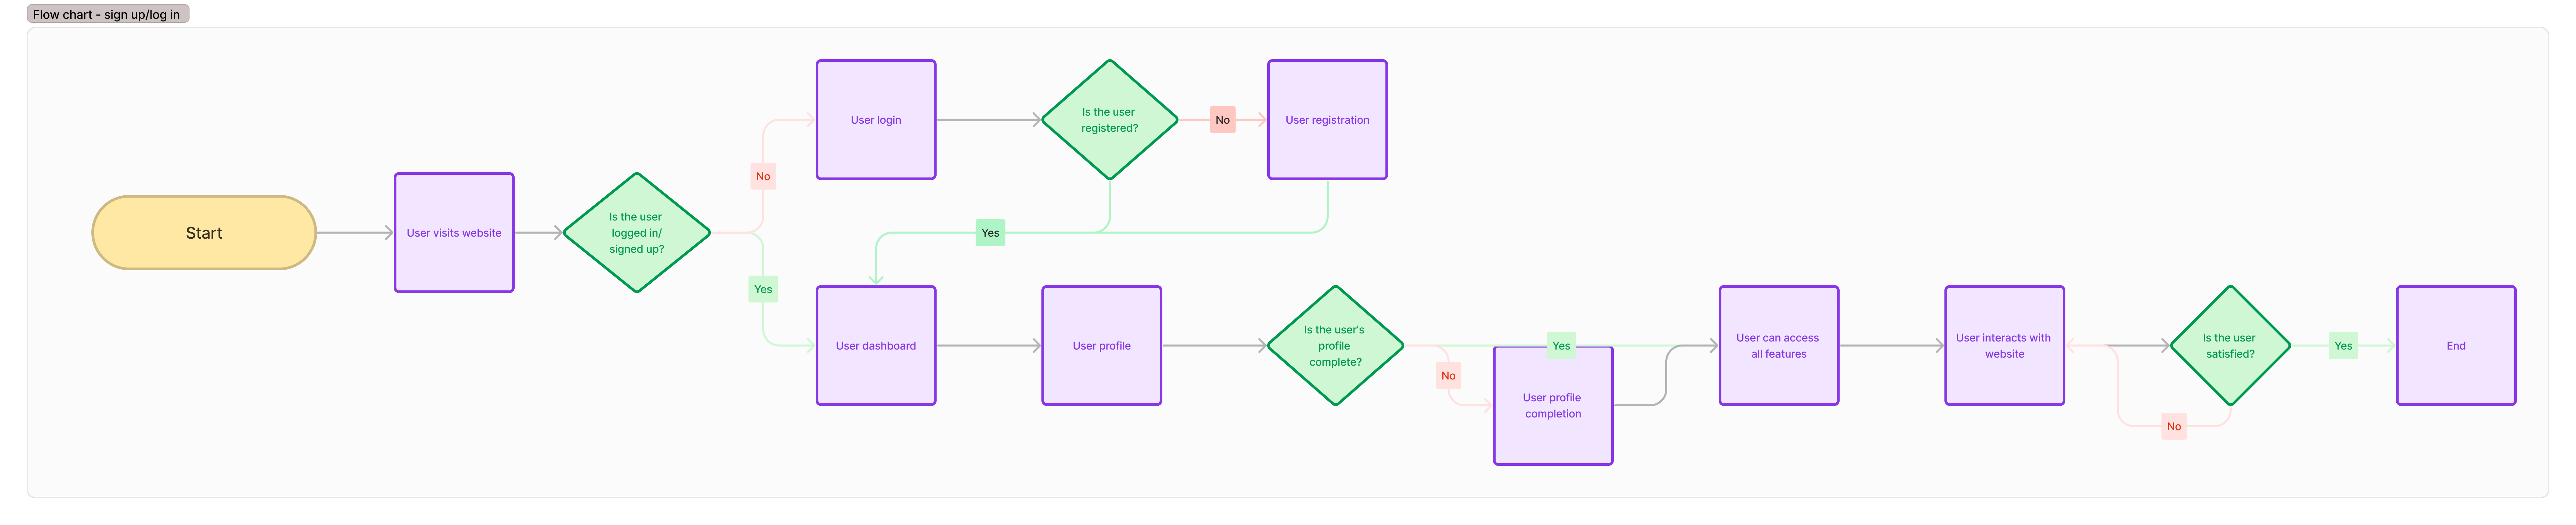
User flows
Flow 1 · Signing up or logging in
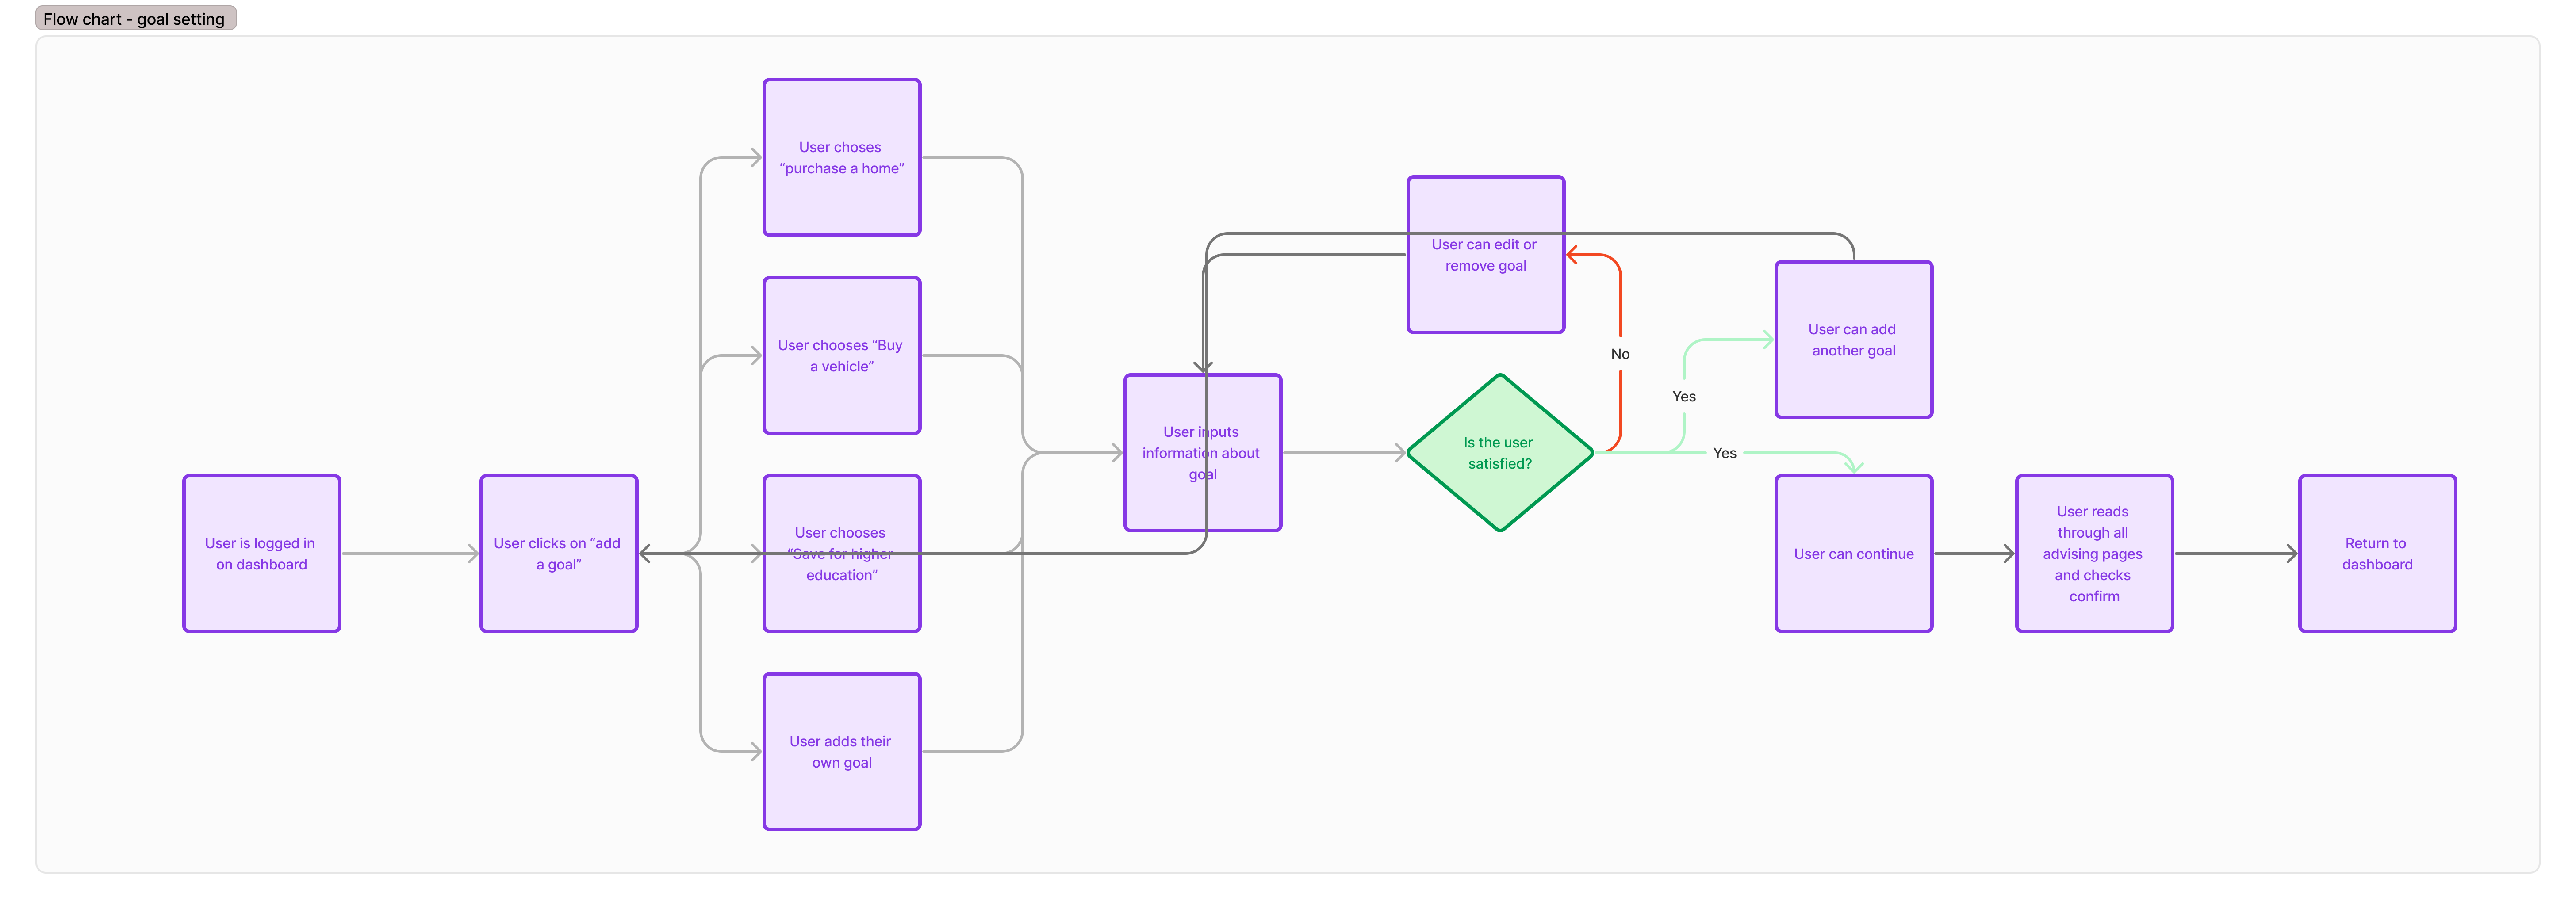
Flow 2 · Setting a goal from the dashboard, once signed in
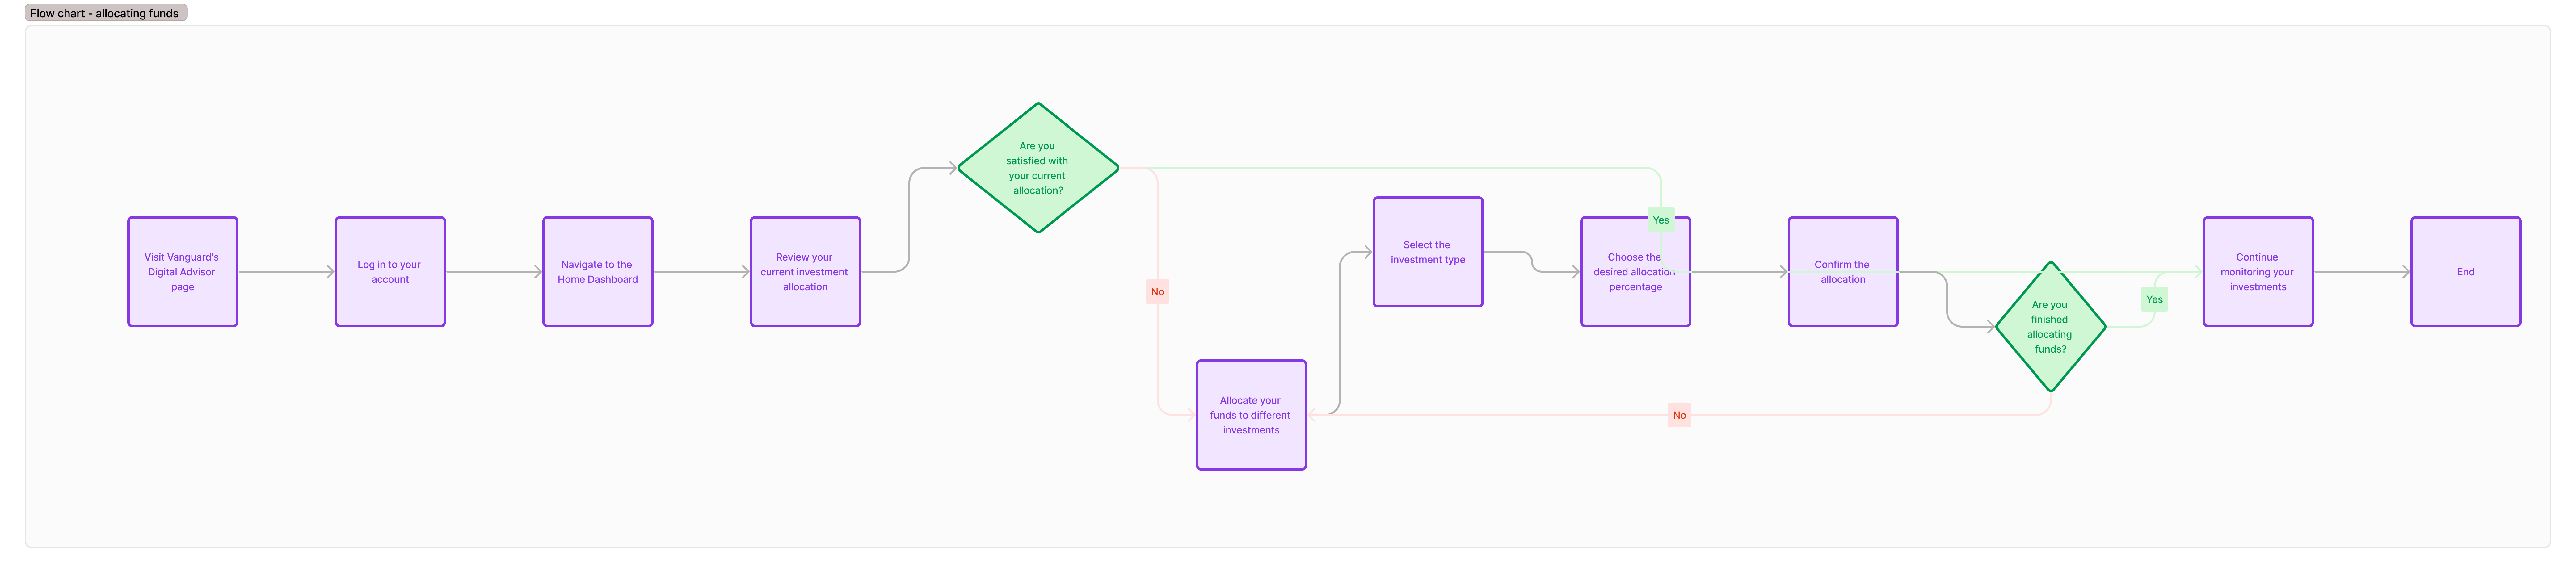
Flow 3 · Allocating funds from the dashboard
The redesign
I turned the research into wireframes and then an interactive prototype in Figma, and tested both with users on usertesting.com.
Wireframes
The wireframes covered the general dashboard and the goal-setting feature. Testers found them intuitive, clean, and easy to use:
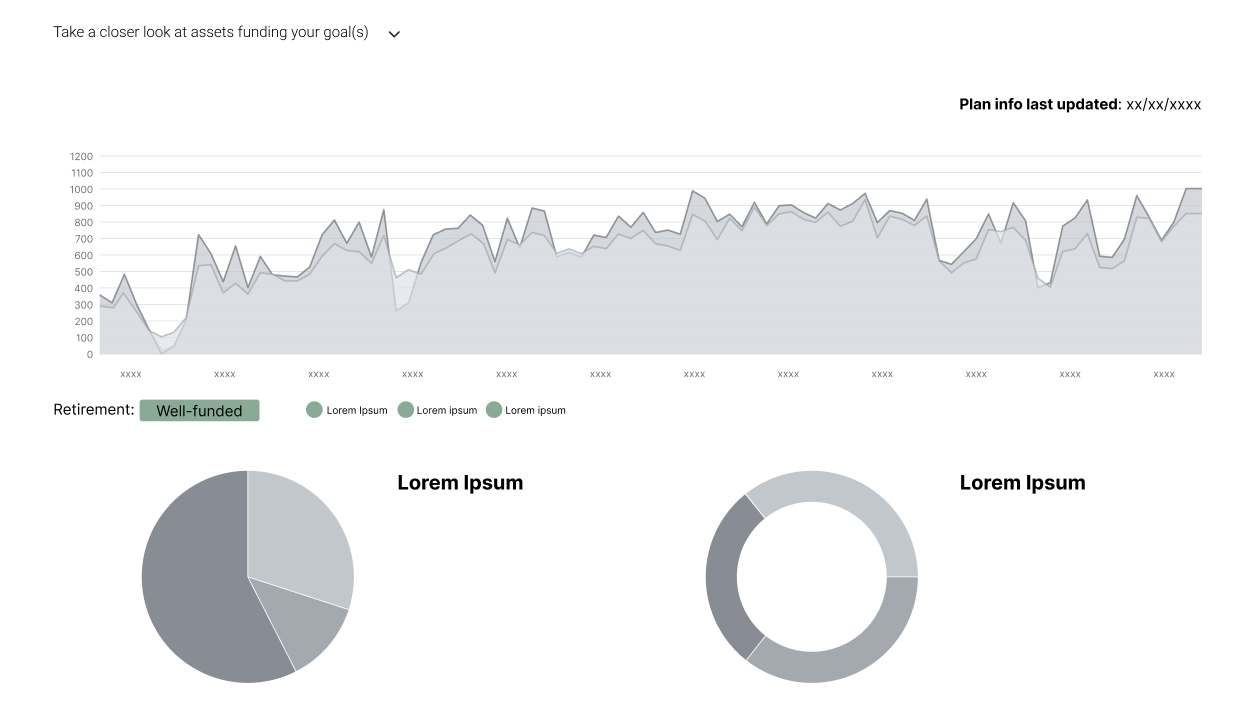
Data visualization
Testers appreciated having more charts to see their assets and how they were managed.
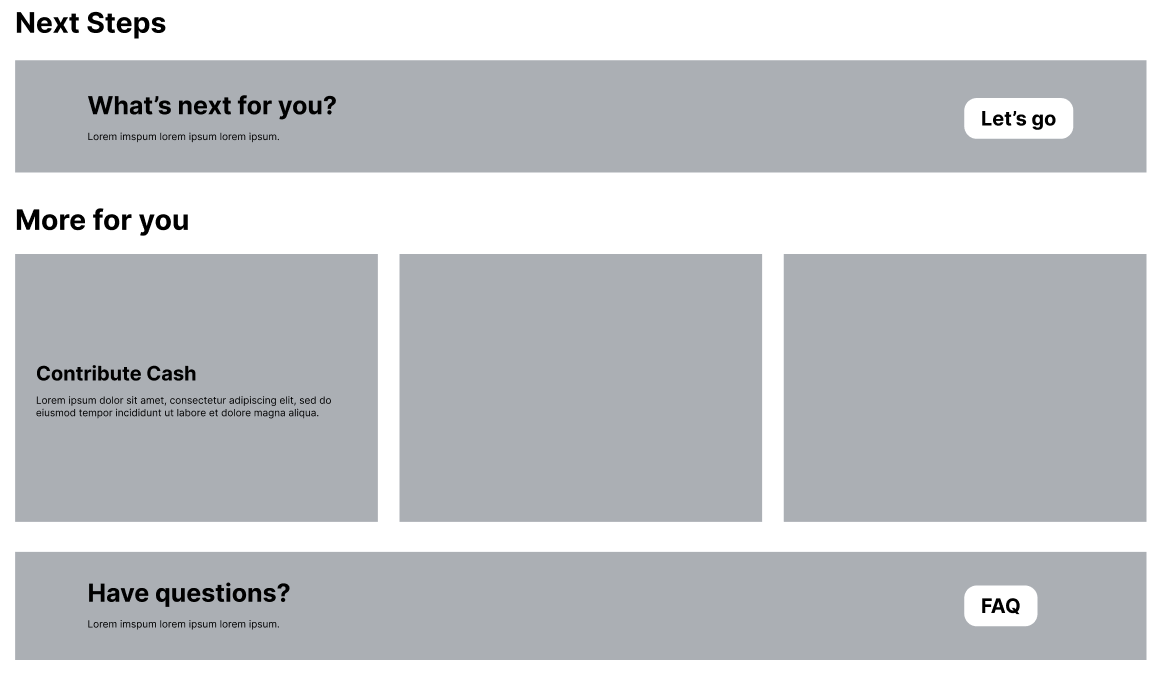
Homepage layout
Simple, intuitive, and not overwhelming, despite the additional features.
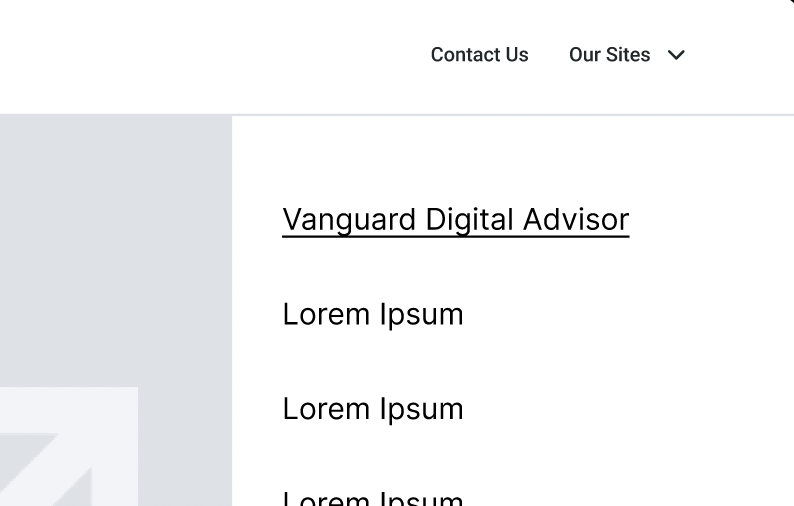
Finding Digital Advisor
Every tester rated it very easy to navigate to the Digital Advisor homepage.
They also wanted more on-page information to explain the process, which is fair for wireframes that only label the important headings. One tester, approaching it as a young adult, noted that the site may be overwhelming because it takes a lot of financial literacy to navigate.
Vanguard UI kit
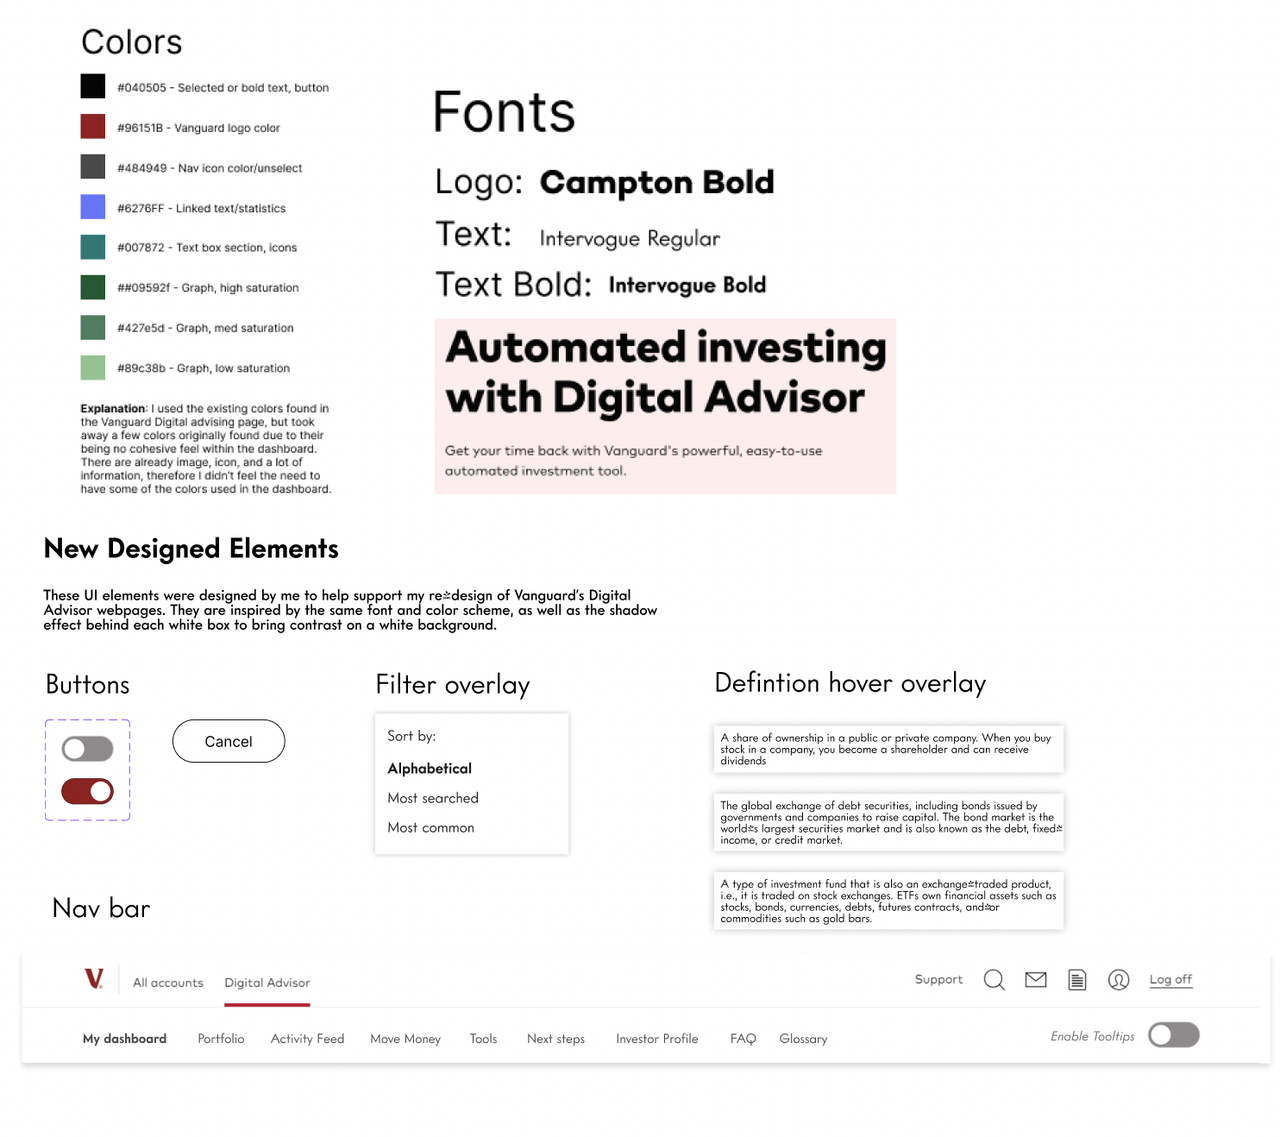
The top of the kit holds Vanguard's original colors and fonts; I kept the palette limited to avoid visual clutter on the redesigned homepage. The new elements at the bottom borrow those colors and fonts and add subtle shadows.
High-fidelity mockup
The mockup adds three new features and a few smaller fixes, all drawn from the user testing.
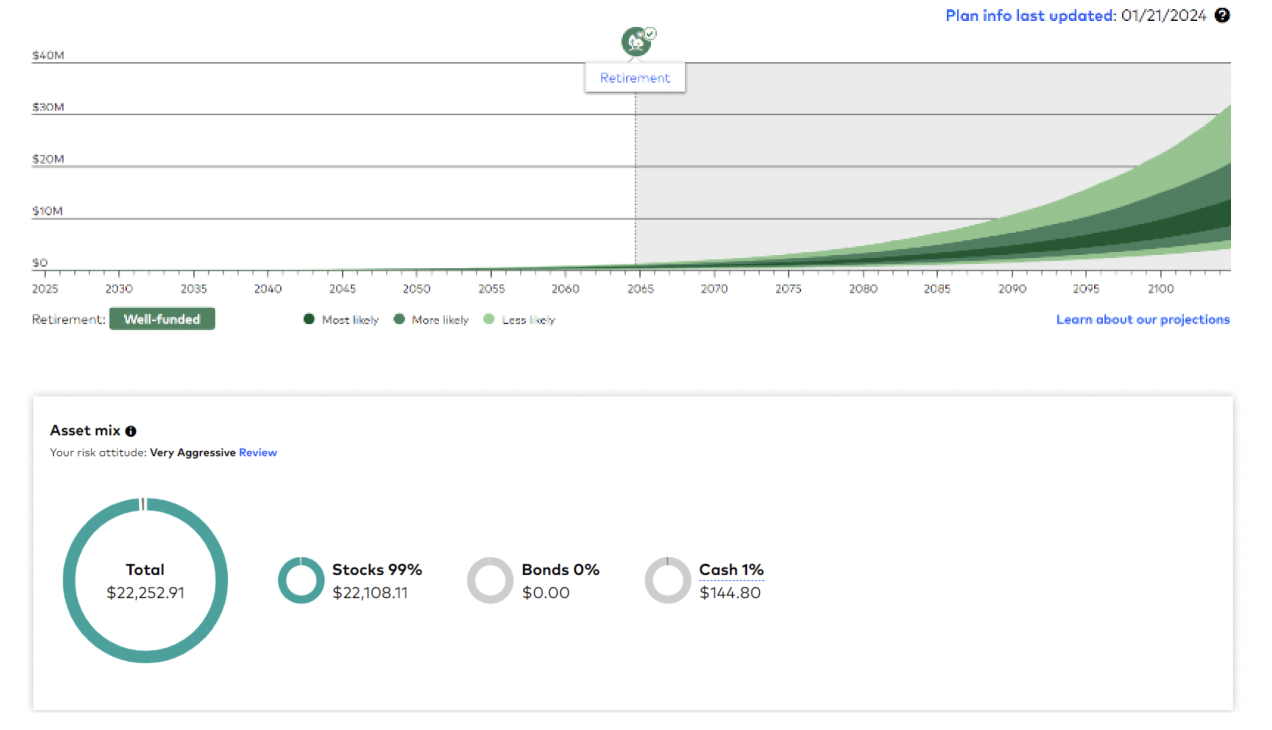
1. More visualizations
More data visualization on the dashboard, so people can see their assets and performance at a glance. The exact charts may differ in a real product; these show the kind of data worth surfacing.
2. Tooltip toggle
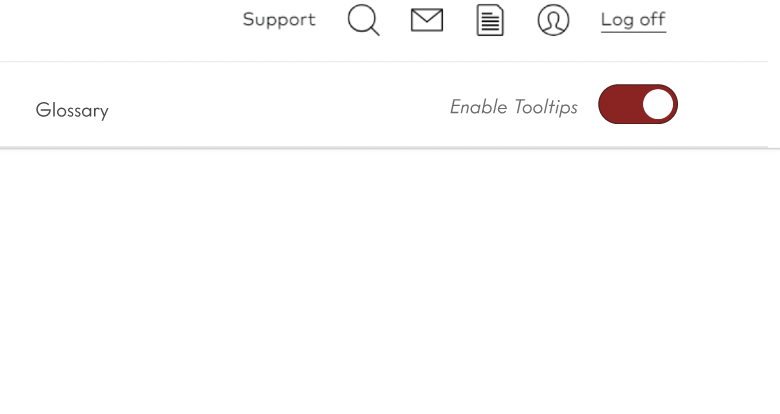
A toggle in the navigation bar that lets people hover over underlined terms and read their definitions. Experienced investors can switch it off just as easily.
3. Glossary tab
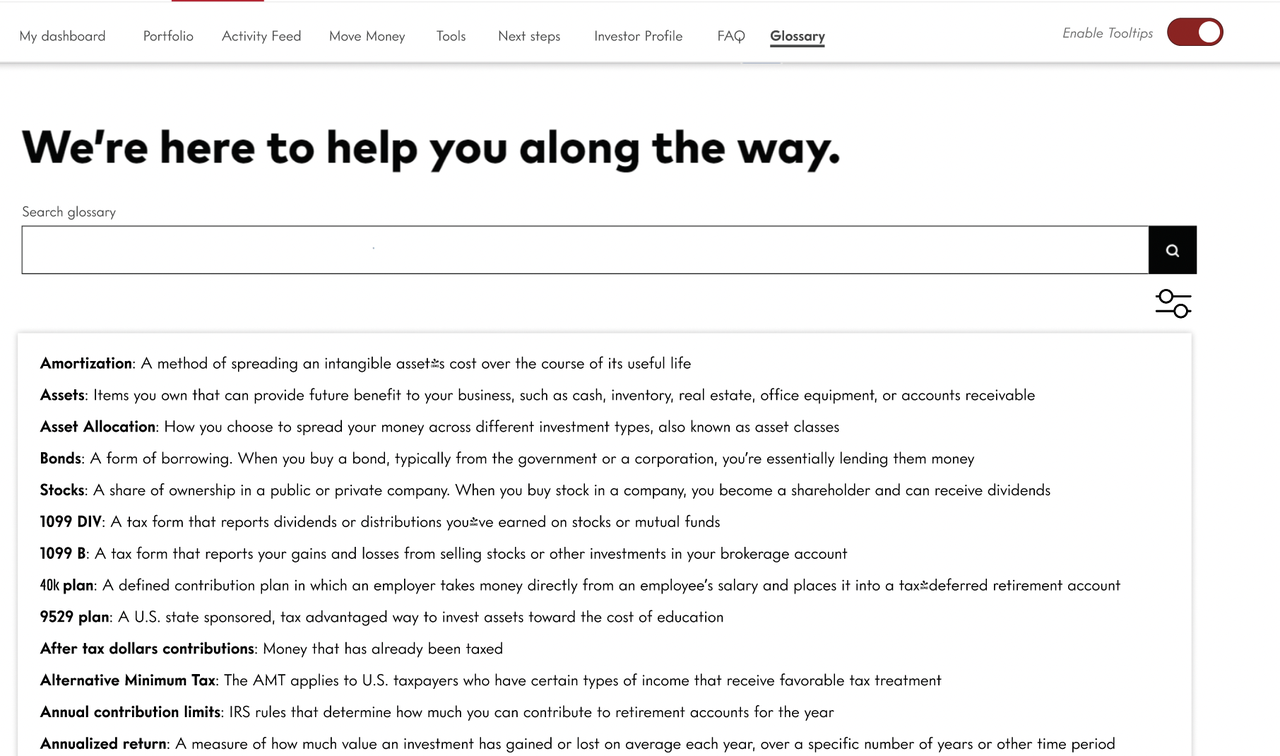
A glossary page next to the FAQ in the navigation bar: an on-hand dictionary for building financial literacy, with filter and search for finding a term quickly.
Smaller fixes
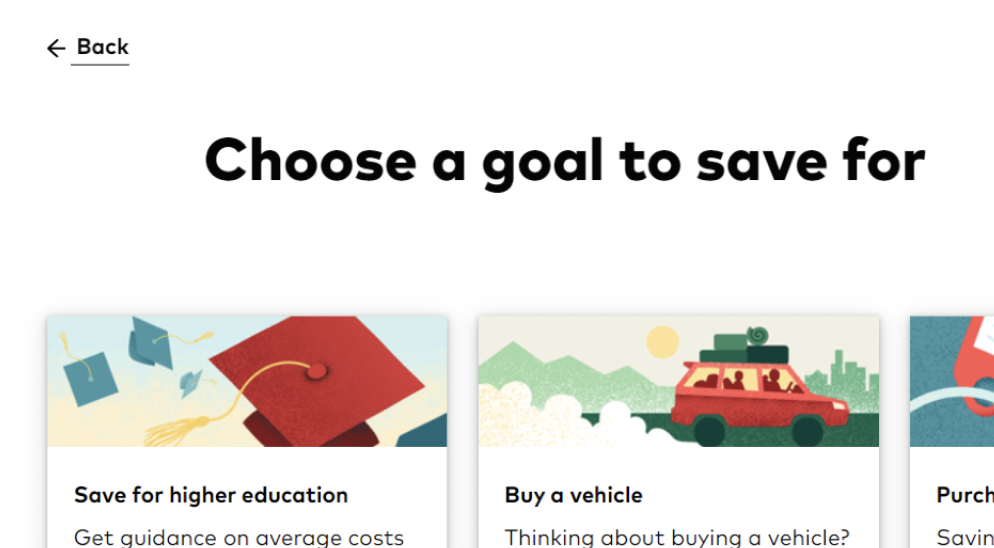
More back buttons in the goal-setting flow.
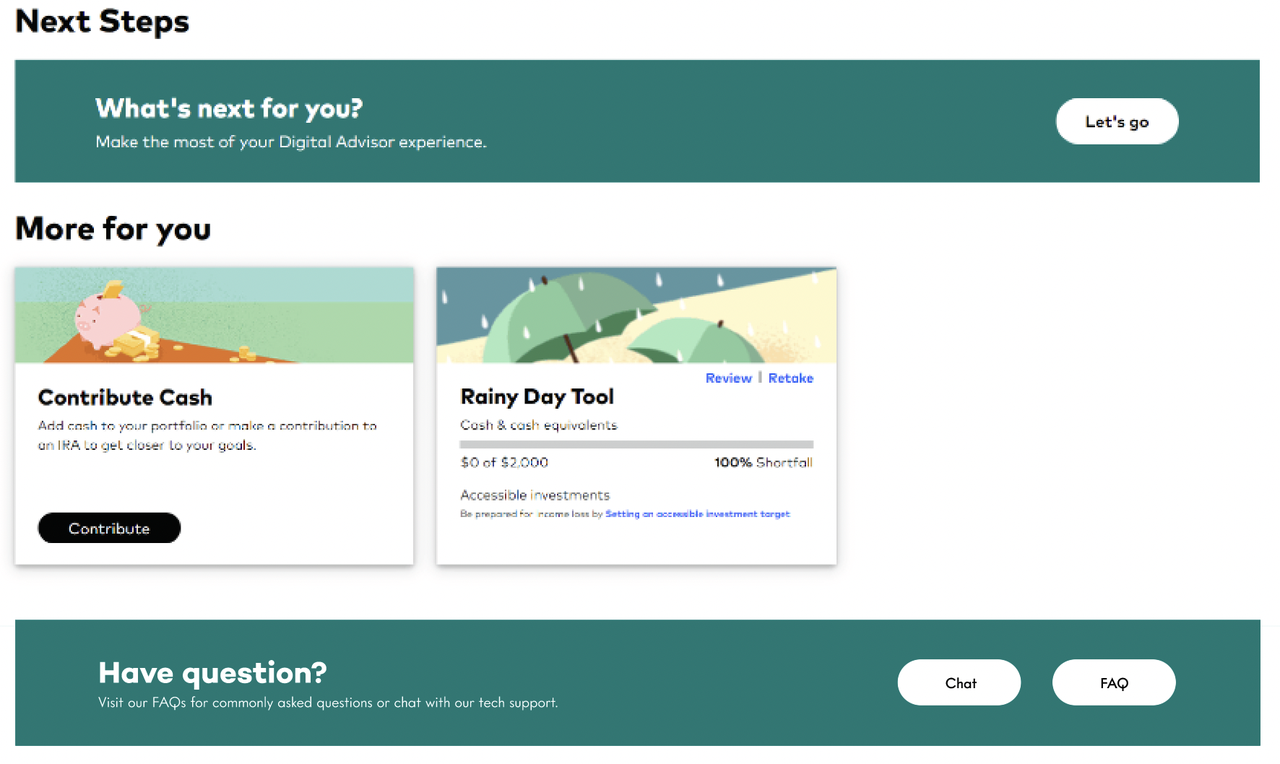
Familiar colors for a cohesive dashboard.
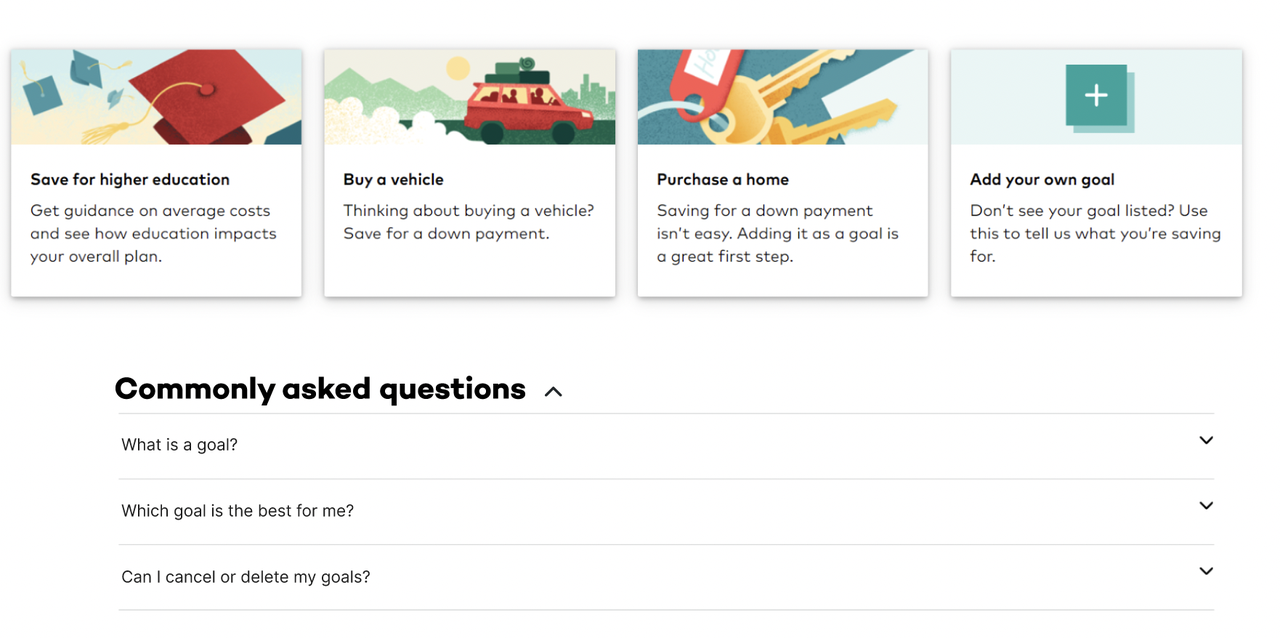
A drop-down of commonly asked questions during goal setting.
What I'd Do Next
If I got the chance to revisit this project, the first thing I'd change is who I test with. Six college students with almost no investing experience told us a lot about first impressions, but not much about how someone who manages their own portfolio would react. I'd want a wider mix of ages and experience levels before trusting these findings at scale.
I'd also let people test with their own information instead of a demo account. So much of investing is personal, and a fake account can only tell you so much about whether the redesign builds confidence.
The Tooltip toggle and Glossary tab were my answer to the terminology problem, but I'd want to test those specific features with users before assuming they work. Right now they're informed by the problem, not validated as the solution.
Finally, I'd push the flows further. My wireframes only covered the dashboard and goal setting; I'd want to design the allocating-funds experience instead of just flowcharting it, since that's the point where someone goes from browsing to investing their money.